We’ve all seen various maps of the world on the walls of libraries, schools, and conference rooms. Some of them display the shape of the Earth’s surface – sometimes, even under the sea.
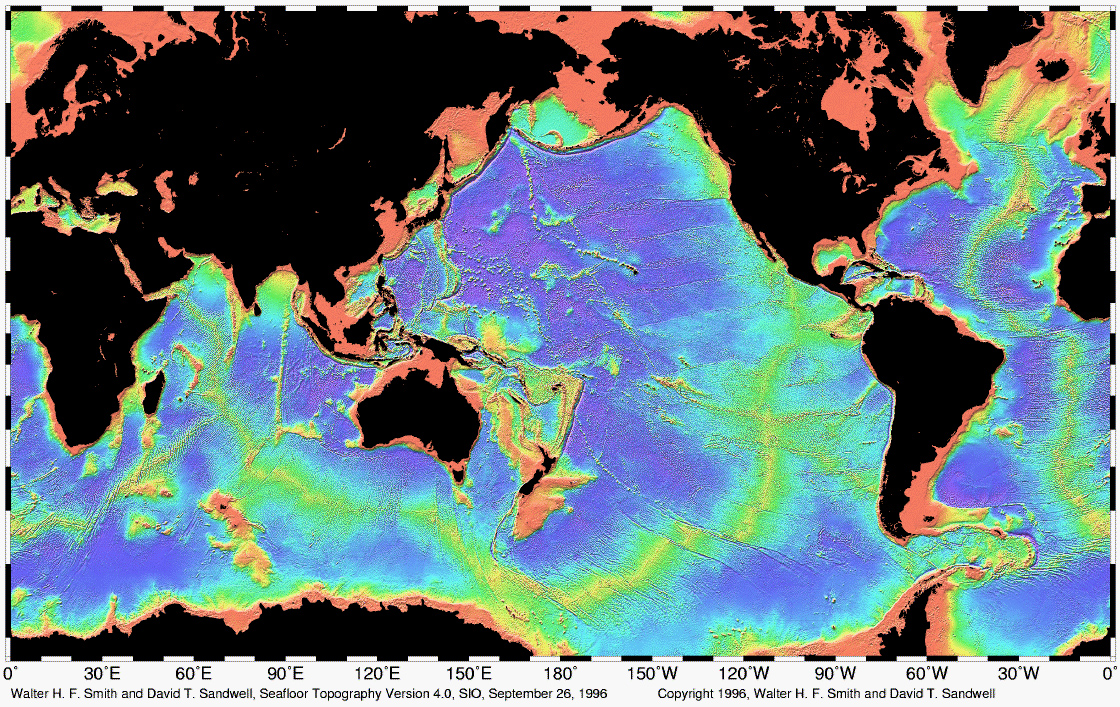
Such features may include the systems of mid-ocean ridges, trenches, and thousands of underwater mountains. Sure, from this perspective—as if looking from space—it does appear that we have already mapped the whole planet. However, if we look closer, for example, from a terrestrial point of view, or better yet, from a vessel’s point of view, we aren’t even close to having fully mapped the seafloor.
Maps often display the satellite view of the Earth. While many of the oceans’ features may be visible, they are mostly in low resolution. Imagine walking around the house while wearing your grandpa’s eyeglasses. It may be possible to make out some objects, but the depth of perception and detail will be quite limited. Many times, the satellite maps cannot display volcanic craters, underwater channels or shipwrecks. That is why we map. Only about 5% of the world’s seafloor has been mapped in some detail. Since the ocean occupies roughly 70% of the Earth’s surface, this leaves approximately 65% of the Earth (excluding dry land) unexplored. That is quite a lot of Earth left to explore!
Most of the seafloor that has been mapped thoroughly is close to shore. Thanks to all of the hydrographers that constantly survey the world’s coastlines, we now have nautical charts (specialized maps) that are used to safely navigate ships. Coastal areas are well surveyed and often re-surveyed because seafloor conditions continuously change, especially close to shore. Hydrographers make sure that ships have the information they need to navigate safely by detecting and reporting new hazards to navigation with each chart update.
This page shows what seafloor mapping data is available around the world. It may look like much of the ocean has been covered when zooming out, but zoom in and take a look around. Note that many of the mapping tracks are between common commercial shipping ports, and along busy coastlines. There are major gaps in the middle of oceans as well as in the polar regions where additional mapping is needed. This leaves most of the world’s oceans largely unexplored!