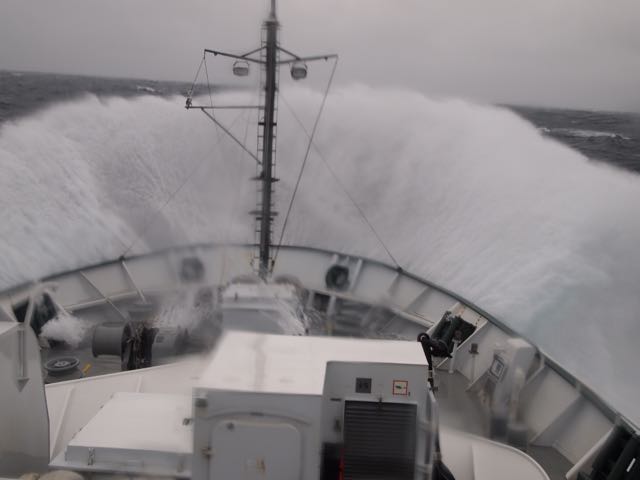
The Tasman Sea is not happy. For the past couple of days, waves have been crashing over the bow, and sustained winds have routinely been blowing above 35 kts. Several of us have been sick, or at best, feeling very tired. We haven’t been able to profile with the CTD/LADCP system. It has been rough.
Labor of Love
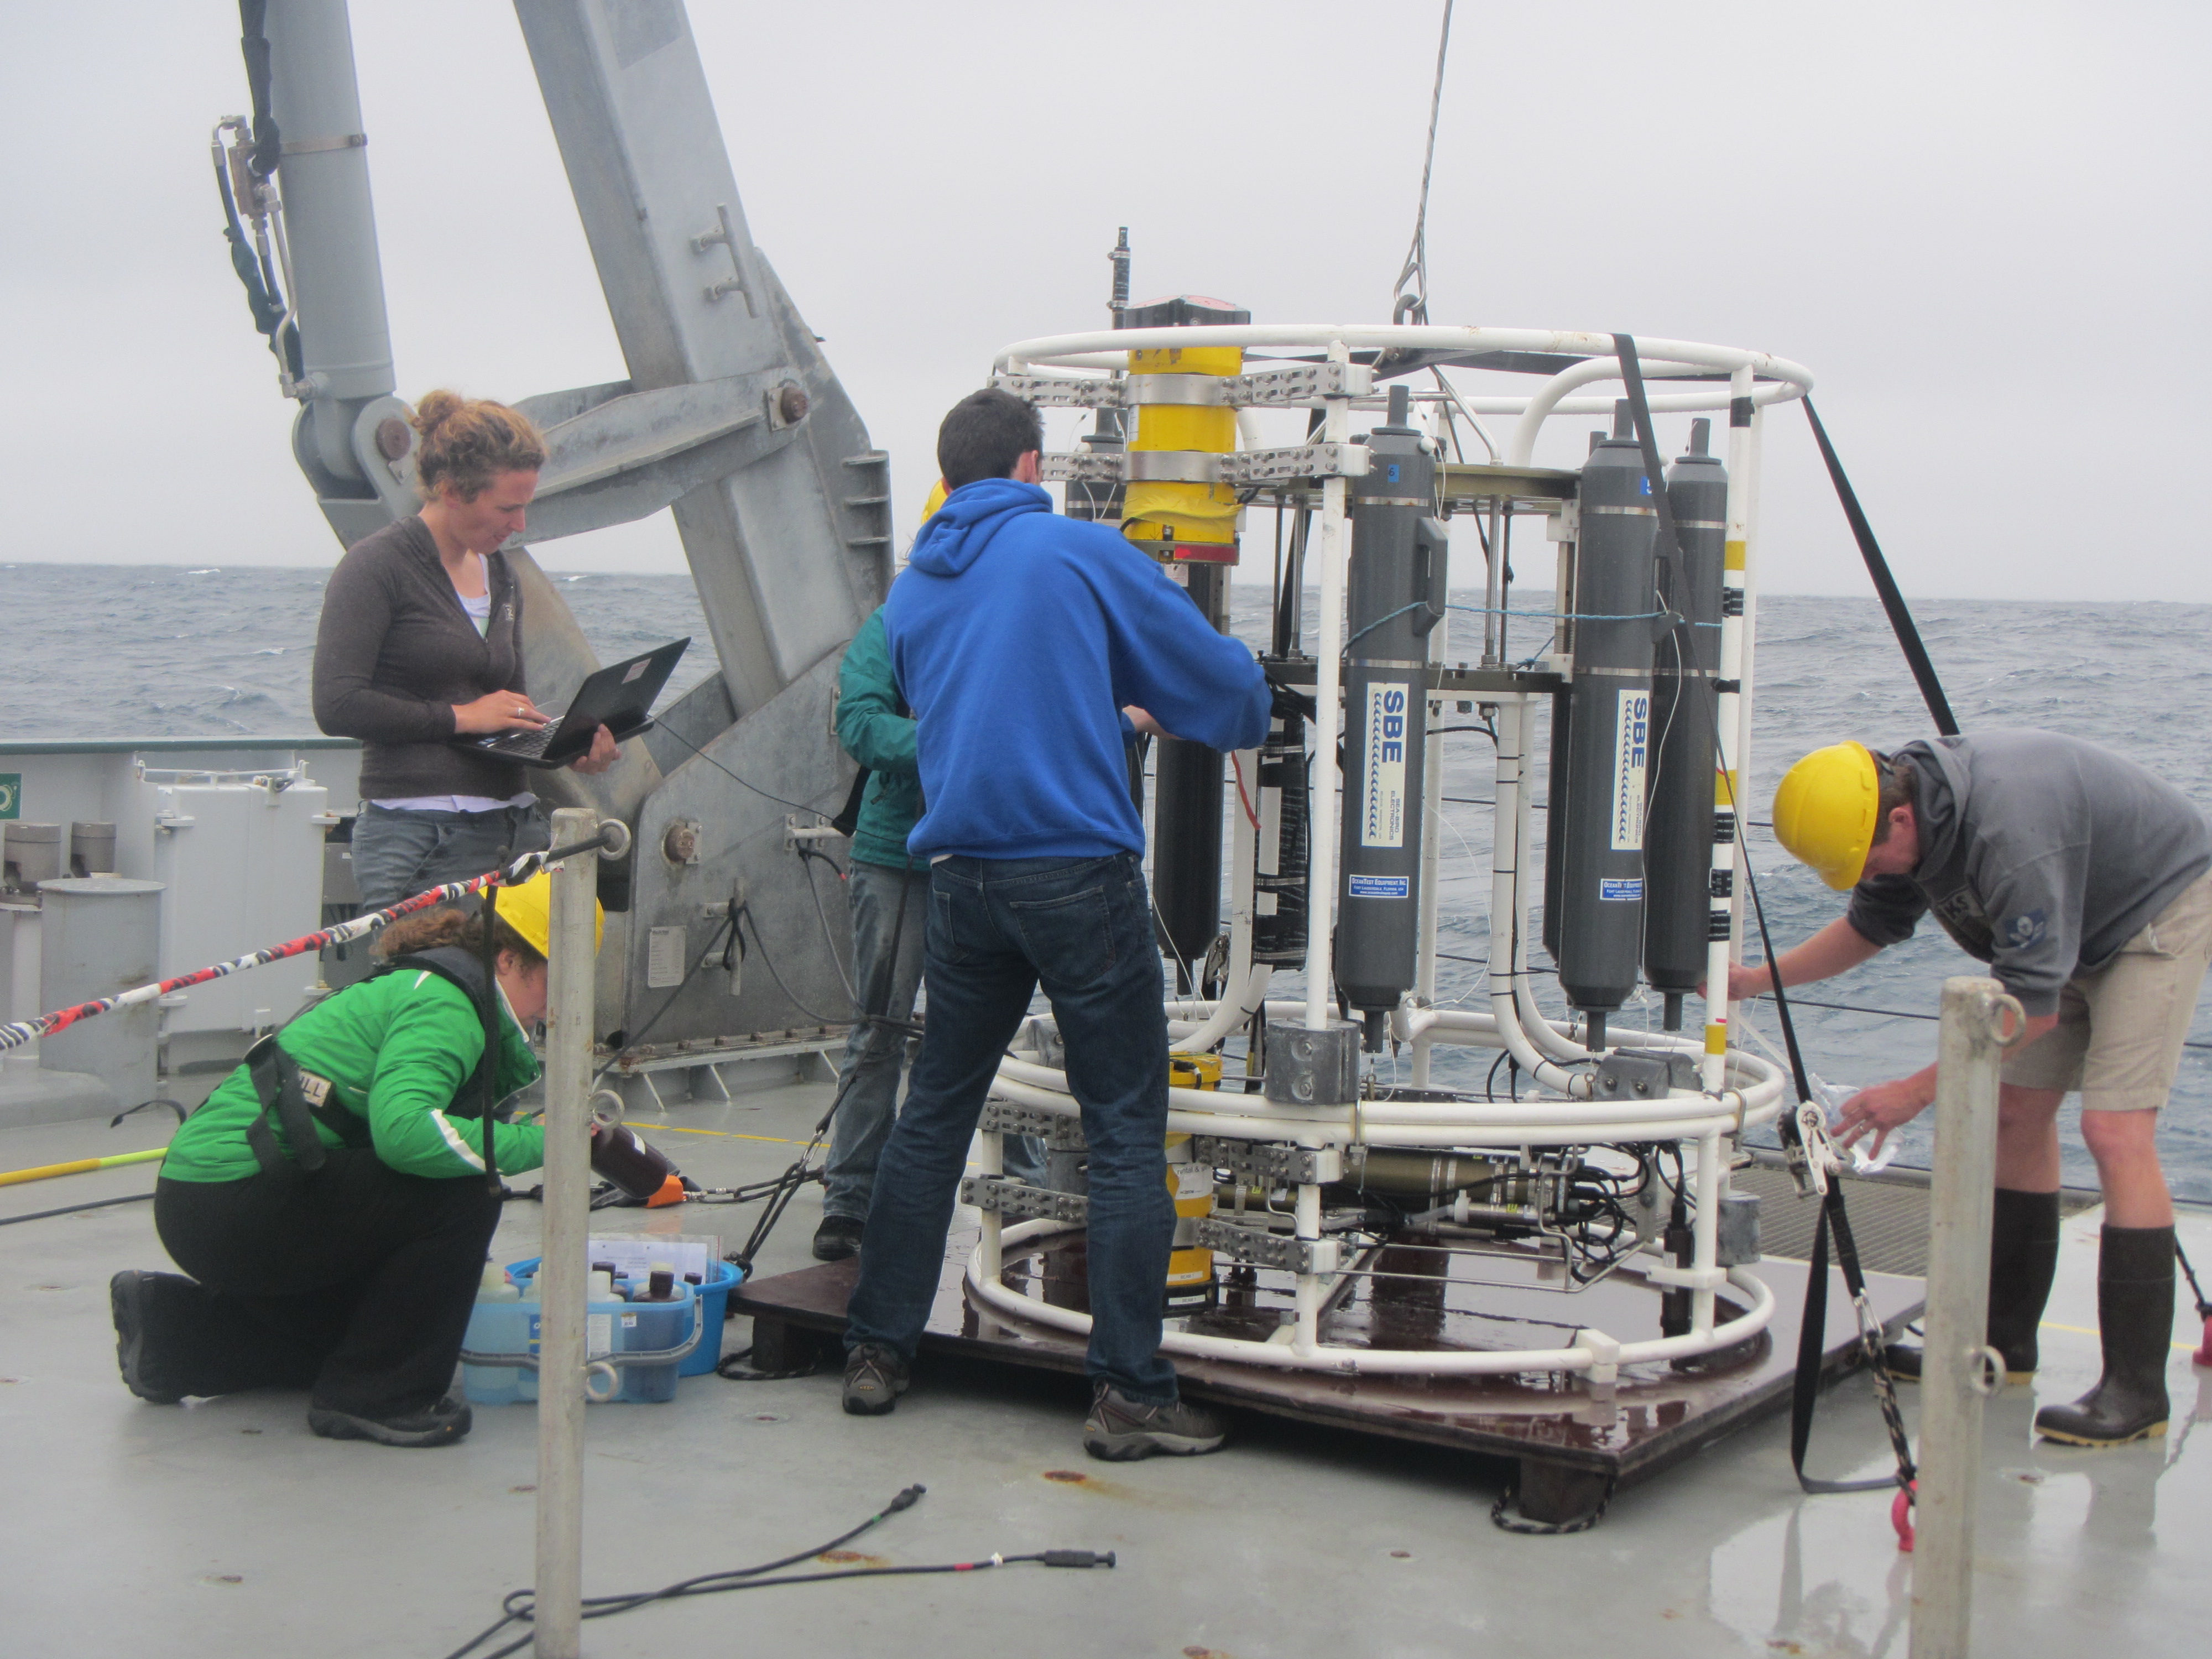
Earlier, I found myself complaining about the rough seas to my wife via text message (having internet at sea is a strange but wonderful luxury!), but she immediately reminded me that, no, I don’t hate this. She is right, it’s true, I love it. Even in these rough seas, I love that I am out on the ocean with a wonderful group of people – scientists, crew, all united in a common goal. We are here to do science and we go through a lot of trouble to get the data. It is truly a team effort.
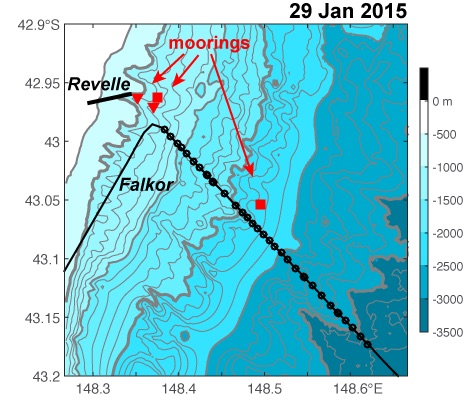
At the beginning of our cruise, and again a few days ago, we have had the chance to work side by side with the R/V Roger Revelle, made possible by National Science Foundation and Schmidt Ocean Institute. What can you do with two ships that you can’t do with one, you might ask. Well… the best answer is probably that the ocean is incredibly complex. In the deep ocean, the crests of the internal waves we on Falkor are studying are separated by about 150 km, going up and down every 12.42 h (the lunar semidiurnal tidal period). The vertical structure of velocity and density fluctuations associated with these internal waves is smooth (“low mode”). As this wave field hits the shelf of Tasmania, the small bumps, valleys, cliffs, and ridges of the bottom topography all affect the waves in slightly different ways. Some portion of the wave field gets reflected as another “low-mode” with a large spatial scale, but some are transformed into wave motions with much smaller spatial scales. Some get transformed into the turbulence that the Revelle’s team is chasing. Resolving this spatial and temporal pattern is difficult – you can’t be everywhere at the same time.
The Art of Science
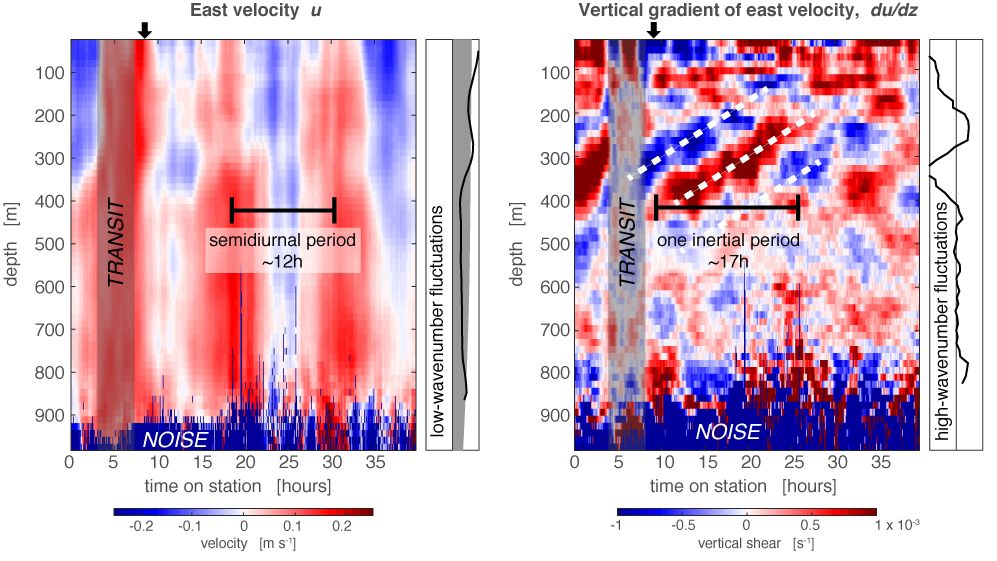
Furthermore, the internal waves we are studying are only one color in a rich tableau. In the Tasman Sea, they are one of the dominant colors, but even offshore we have been seeing all sorts of other motions complicating the picture. There are temperature fronts, mesoscale eddies, near-inertial currents, and internal waves generated by the wind (we see plenty of these last week – see Fig. 2!), etc. Ultimately, that is the reason why, in addition to the moorings, which take measurements at fixed locations, we are doing these ship surveys. We want to understand the three-dimensionality of the semidiurnal waves, and separate them from everything else.
A couple of days ago we met up again with the Revelle for a few hours to do another survey that might clarify some of these interactions and structures. Falkor did an along-slope survey, collecting profiles of temperature every 0.5 km (with XBTs) and measuring currents with the shipboard ADCP along the section where our moorings are deployed. Meanwhile, the Revellewas doing a time series at the shallow end, resolving how things evolve in time. We will connect all this spatial and temporal data for years to come. Of course, all these motions impact each other. Perhaps, like with a good impressionist painting, it will only make sense once we take a few steps back and consider the whole picture; waves, swirls, and all.
So, Melissa, my Love, you are right. I don’t particularly like the stomach-turning pitch and roll, but I love that we are here to experience it with the crew of Falkor and the Revelle, working together to advance our knowledge of the ocean.