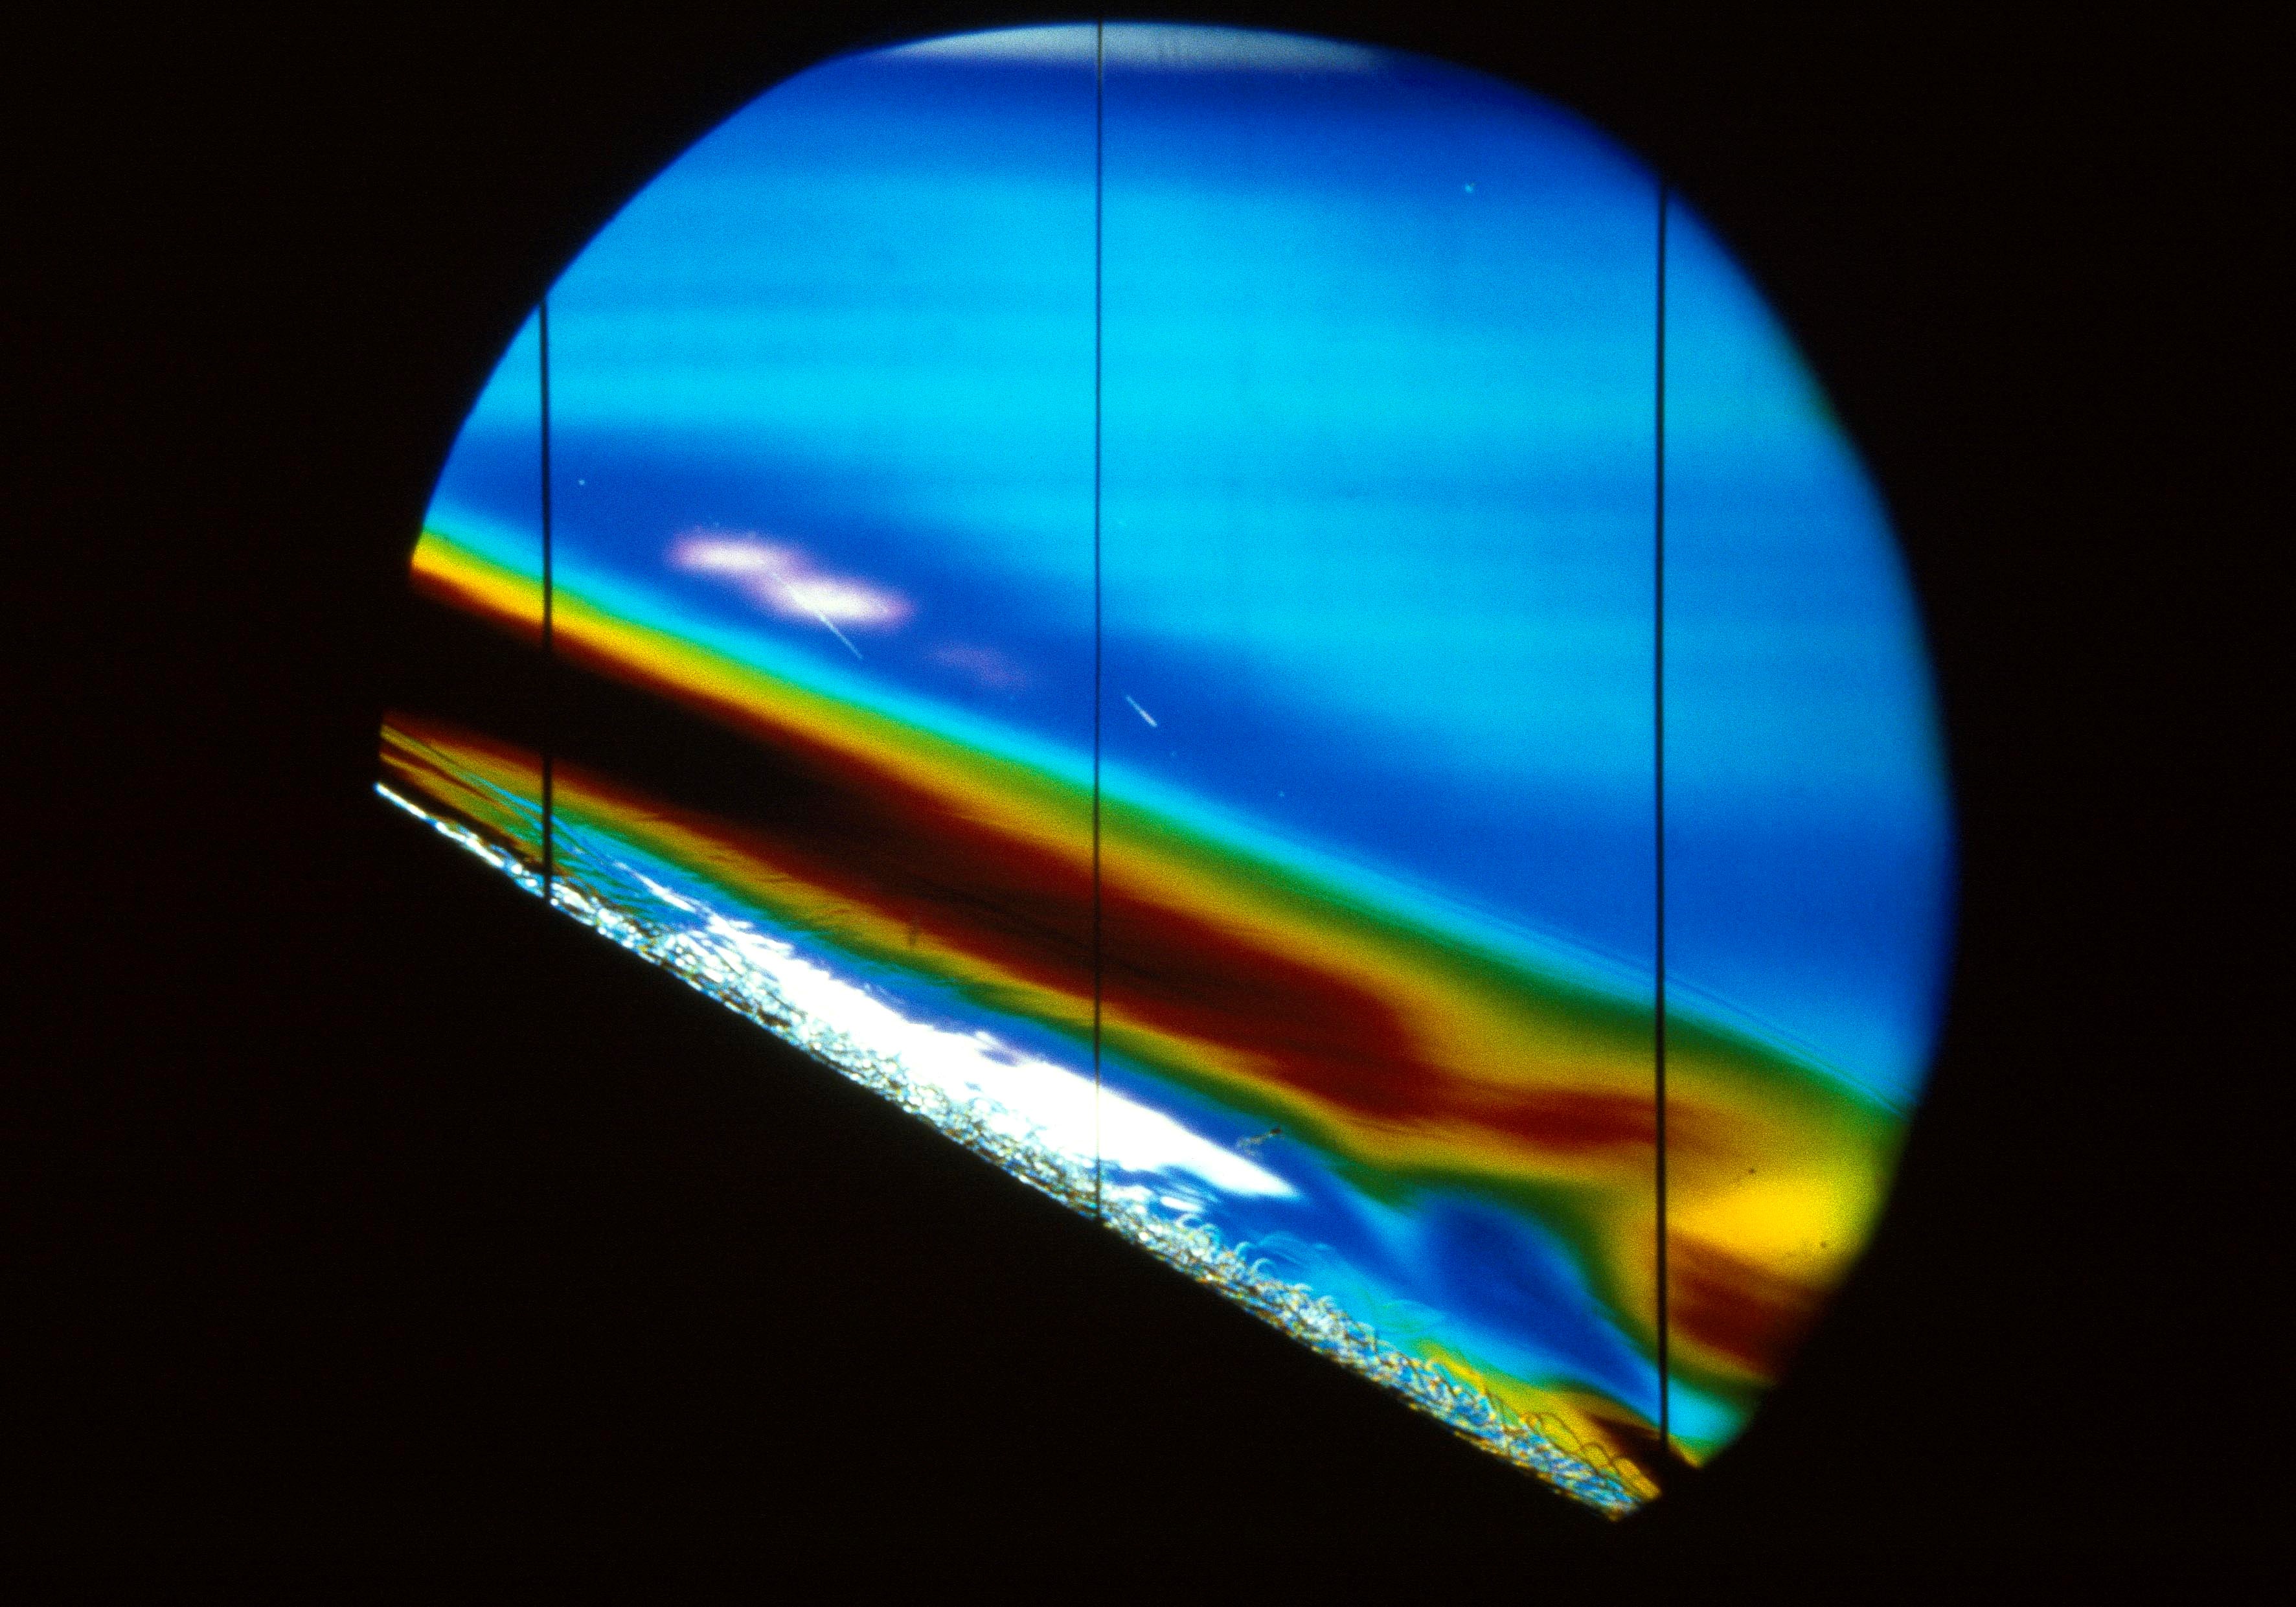
Today we start mapping the pathway between the surrounding ocean and the amazing coral population of the Scott Reef system. Due to the lack of rainfall and strong heating in the region, the ocean has a very strong vertical temperature gradient – as much as 30 °C at the surface, and then colder as you go down in depth. This thermal gradient makes the ocean very stable and resistant to vertical mixing, and as a result the surrounding surface waters are generally nutrient poor in the upper 100 m. One of the very important science questions is how can such a biological hotspot therefore exist in a nutrient-poor ocean? Or how does the deeper, colder and relatively nutrient rich water come up from depth and pass into the shallow Scott Reef lagoons? What is the mechanism that drives the flow and what is the pathway towards the surface?
Strong tides
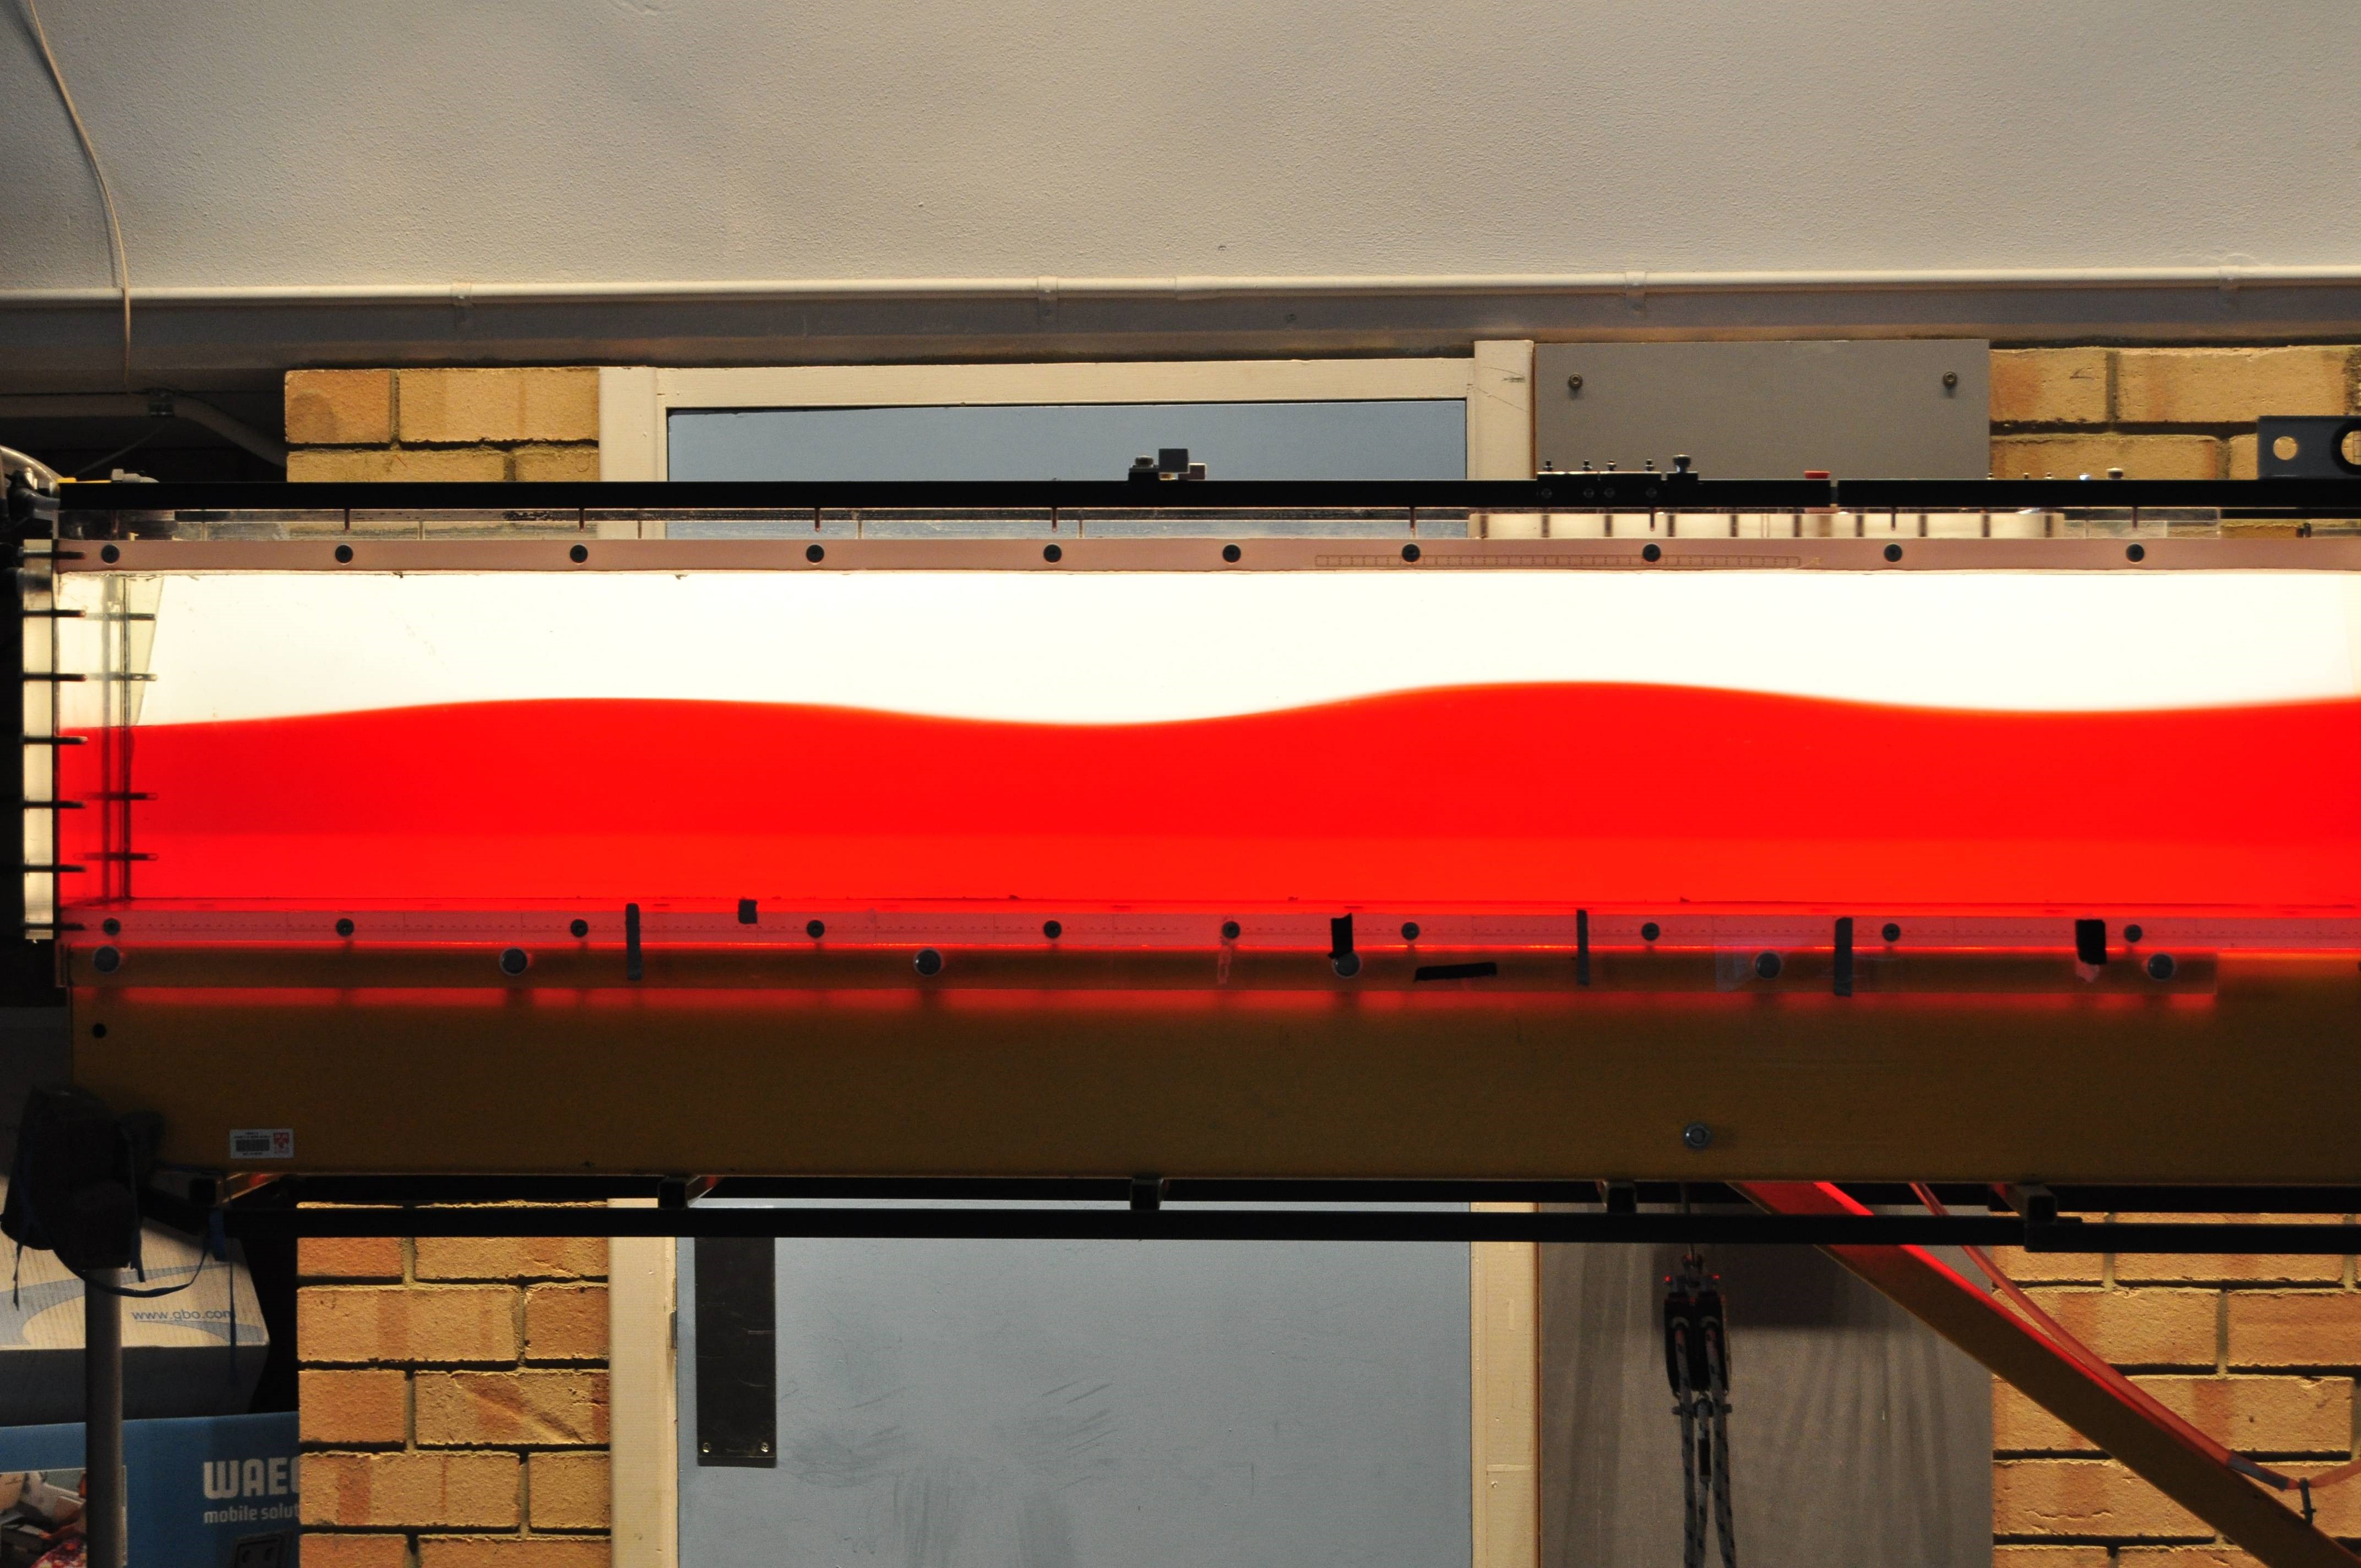
The North and South lagoons at Scott Reef are separated by a very steep-sided narrow channel with a minimum depth of 400 m, width of 2 km, and length of about 30 km, and is a natural transport path between the outside ocean and the reef. The strong tides force very strong flows through this channel, creating a type of internal wave with cold dense water from the bottom entering into the lagoon. With currents as strong as 1 m/s, and the direction of flow completely reversing approximately every 6 hours with the tide. To measure the strength of the flow and the turbulent mixing in this central deep channel we use a combination of two methods. First, we use moorings that measure the flow over the depth, and second we measure the flow rates and turbulent mixing over the entire depth from the mobile observation platform, research vessel Falkor.
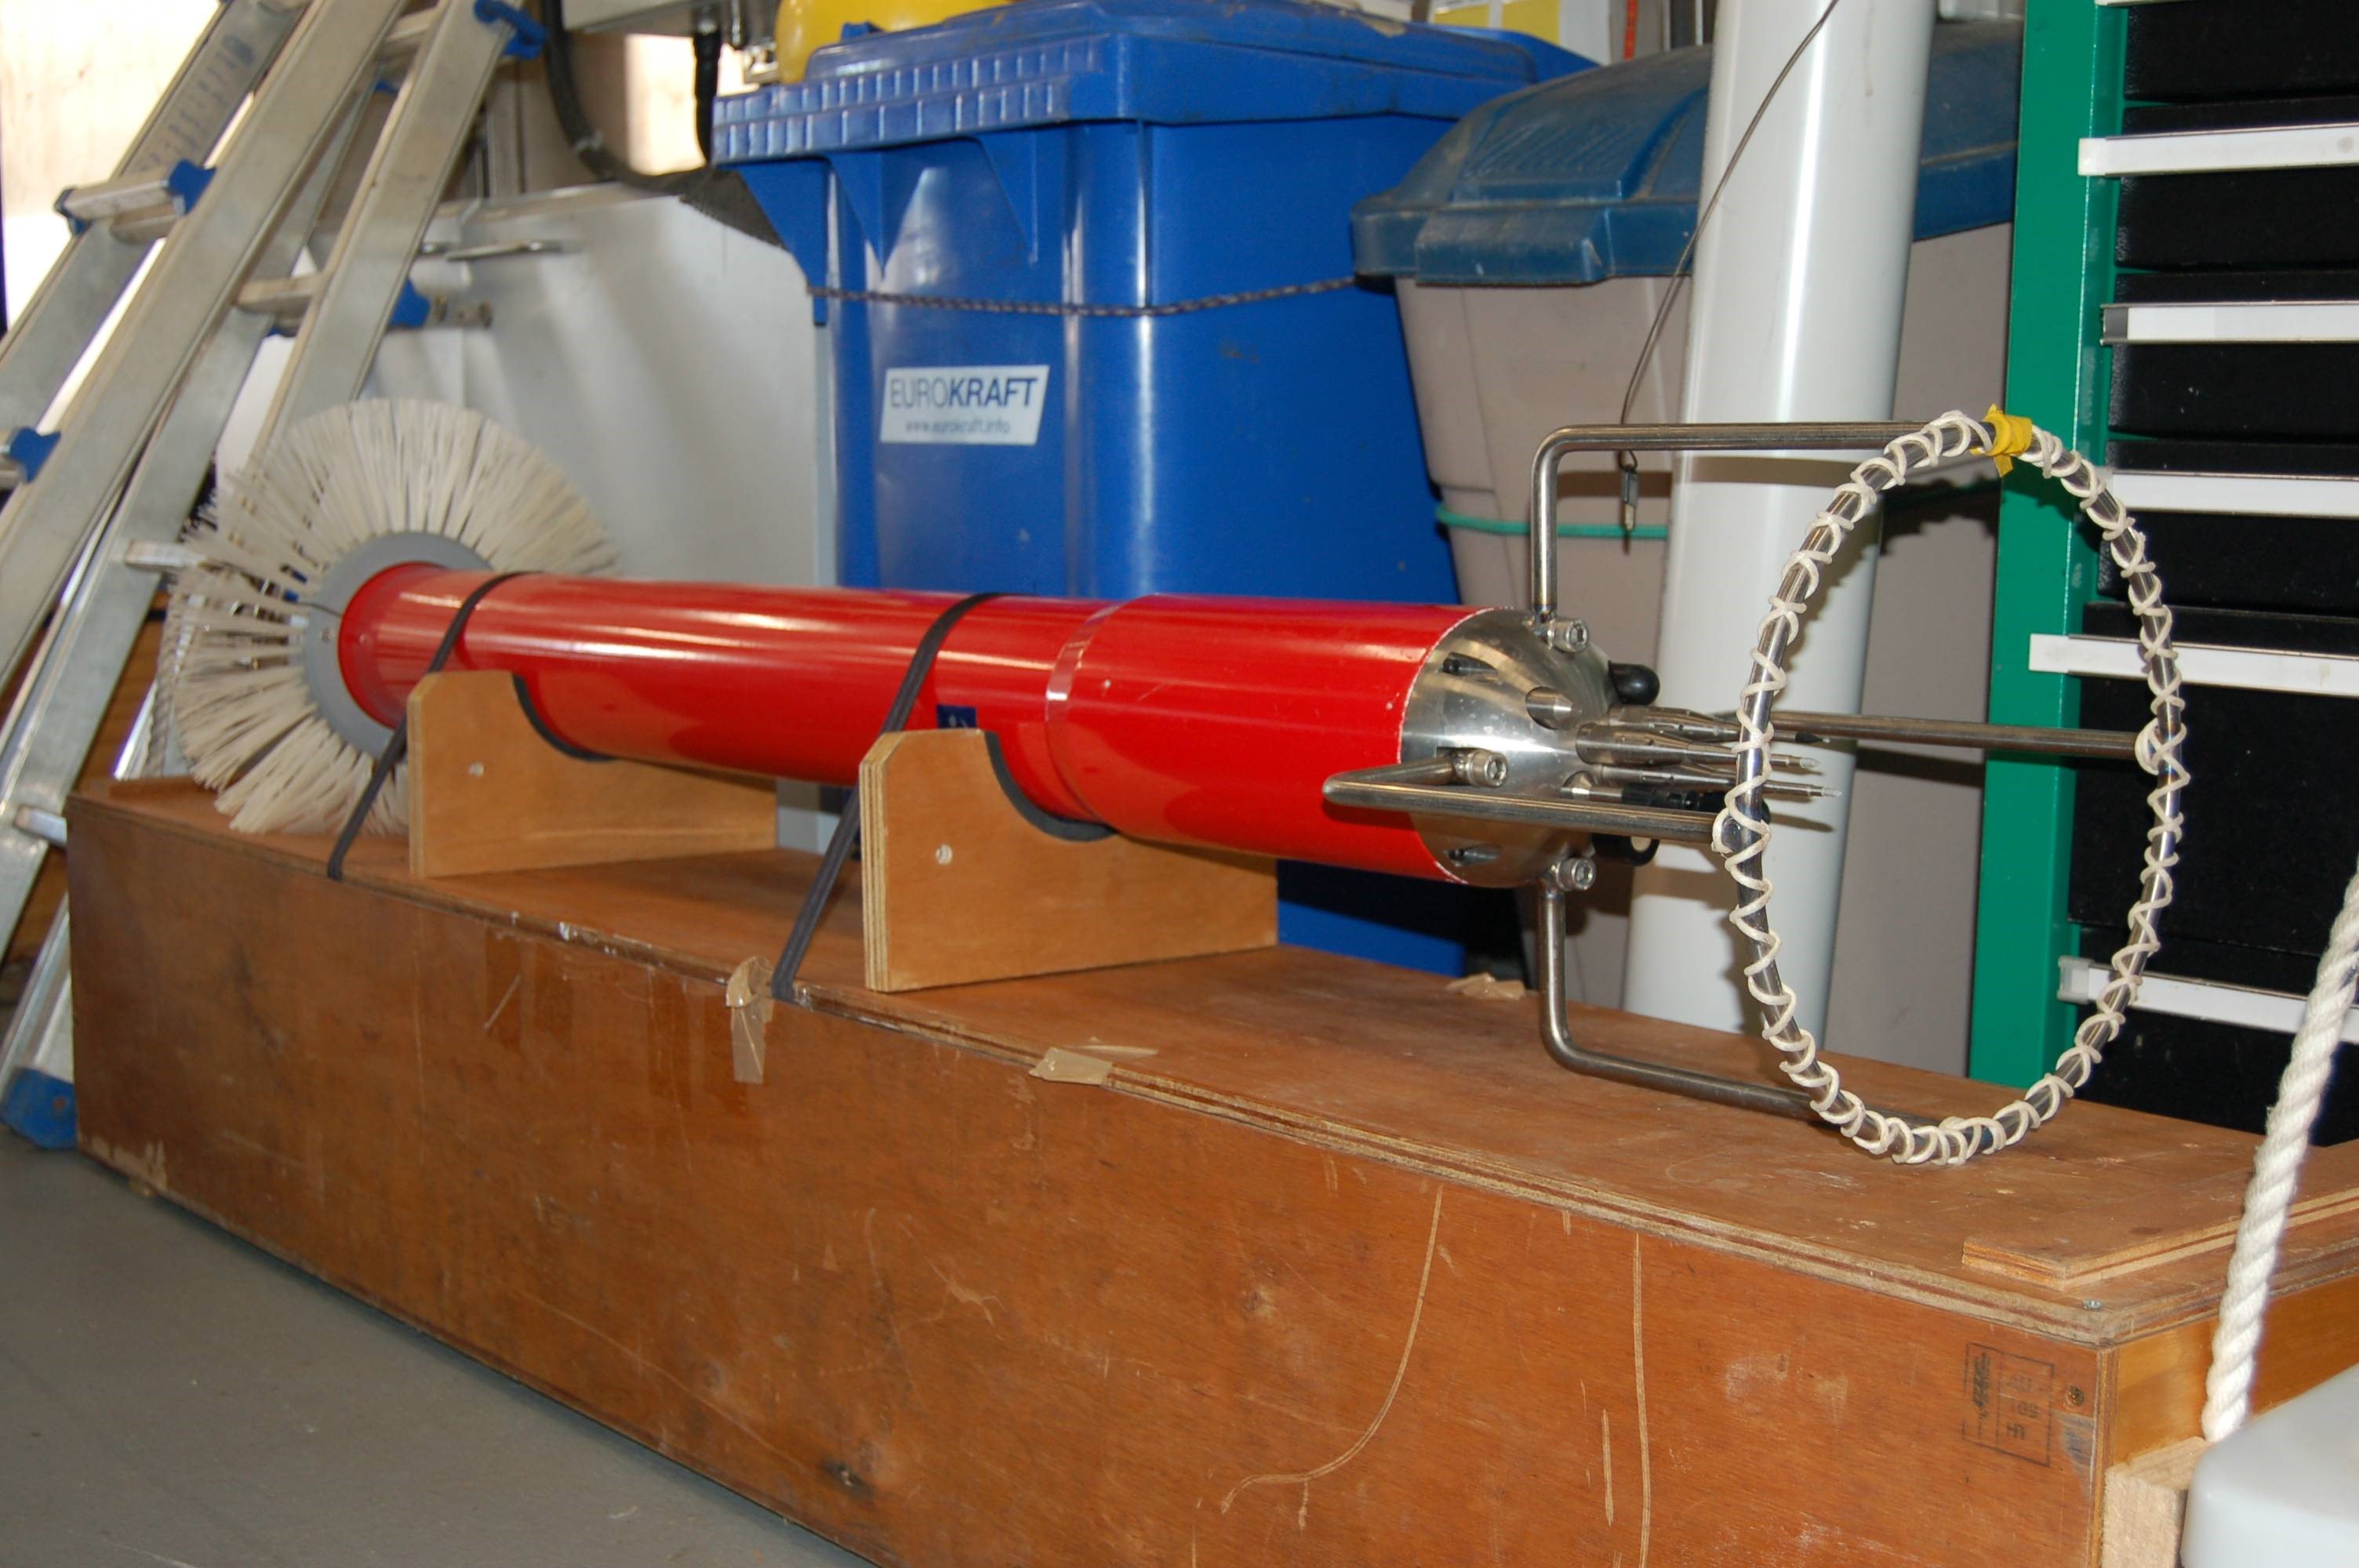
Even in strong flows, the ship uses satellite information to maintain its position at any location within approximately 5 m (smaller than the ship length of 83 m). Using the onboard acoustic systems, the science team can then measure the current speed and direction beneath the ship all the way to the bottom. We are also able to lower instruments which log data as they descend to the ocean bottom before being pulled back to the surface, and the process repeated. The two main instruments for this purpose are the CTD profiler and the Turbulence Profiler (called TurboMAP).
Trapping water
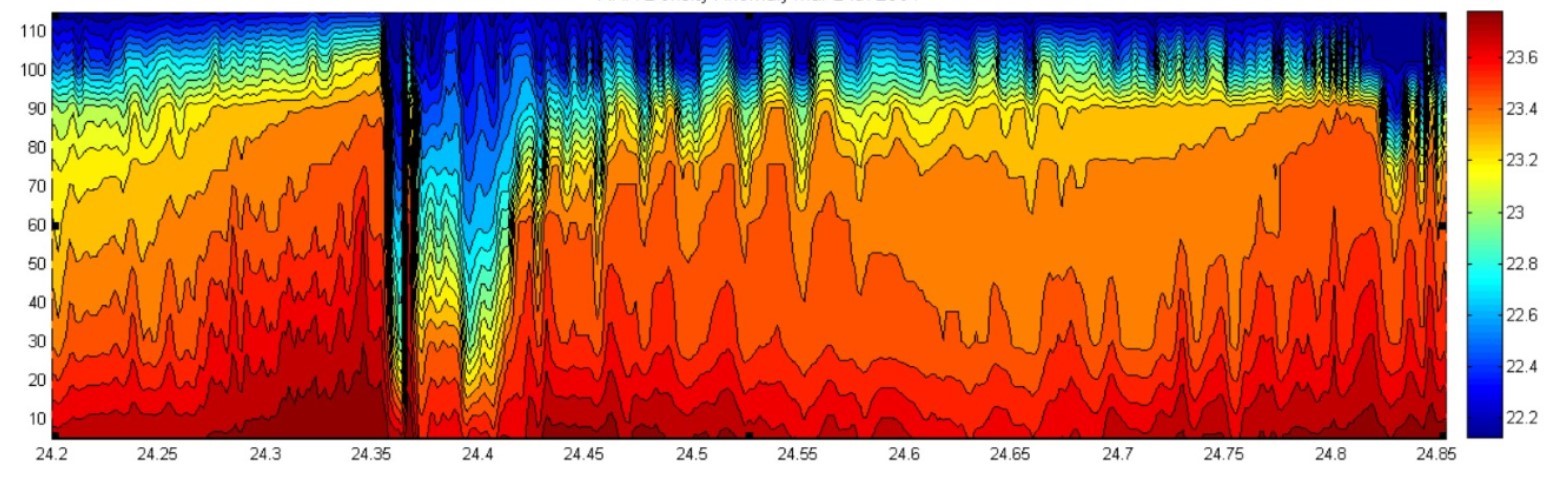
By combining these tools, we will be able to show that the tide literally pumps colder nutrient-rich deep water, perhaps from as much as 250 m deep, up through the channel and into the bottom of the lagoons. This bottom intrusion is a type of internal bore or wave and is highly time-dependent. As the tide reverses, not all this new ocean water is drawn back, rather some is trapped inside the lagoon. Overall this what we believe to be the pathway for the nutrients to come from the ocean and into the lagoon, and one of the important processes we wish to identify on this cruise.