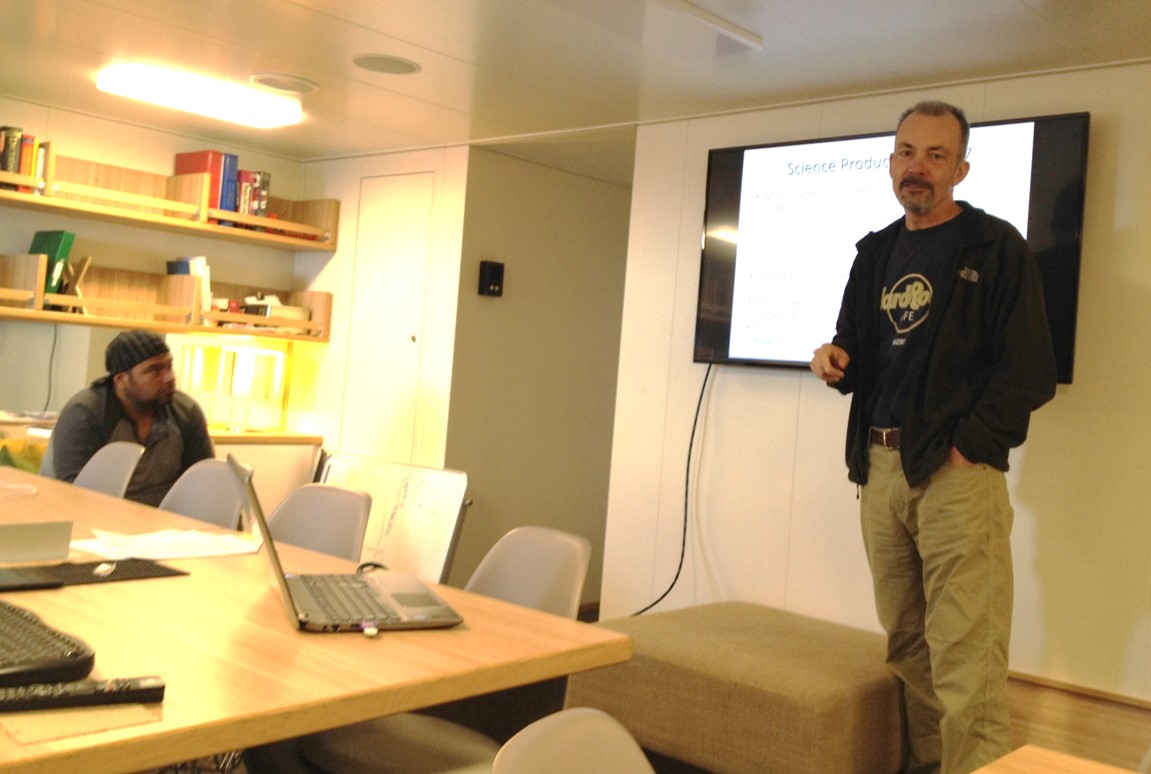
Today Dr. Sager hosted our first of many science updates to keep everyone up to speed on our progress. R/V Falkor is still a few days from Shatsky Rise, home to Tamu Massif, but the ship is performing well and the weather has been nice. We anticipate a speedy arrival with good weather forecasted for the next week, and a 10 knot cruising speed. “Maggie”, our magnetometer, and the EM-302 (multi-beam echo-sounder) are performing as expected with data coming in and being processed (more on processing later).
What are we using to map the ocean floor?
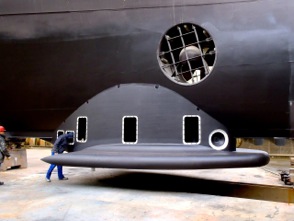
In yesterday’s blog, we mentioned “Maggie”, but have yet to introduce the EM-302, multi-beam echo-sounder. Built into the hull of R/V Falkor,the EM-302’s main purpose is to map the seafloor and for this expedition, mapping parts of the ocean that have never been mapped before.
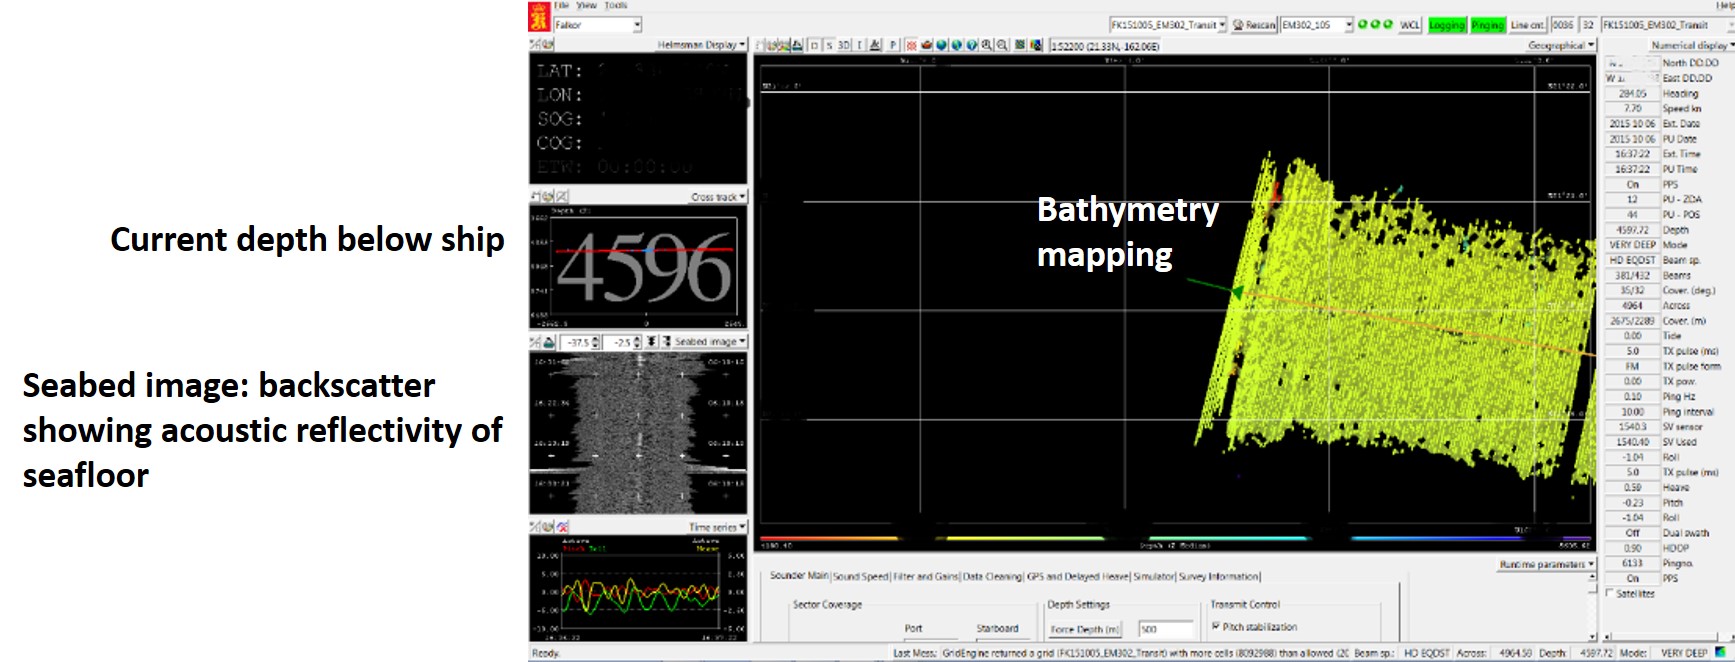
The basic process of mapping can be understood by knowing the speed of sound in the water, and the time of the trip taken by a sound pulse from a transmitter aboard the ship down to the ocean bottom and back. The total distance travelled by the pulse, therefore the depth of water (half that distance), can be calculated. The labeled screen image shows the depth right below the ocean, a seabed image, and a 3D map of the ocean floor produced using a similar process to the one mentioned above. The watchstanders must carefully observe all these data on the screen to make sure everything is logging correctly.
Single versus Multibeam
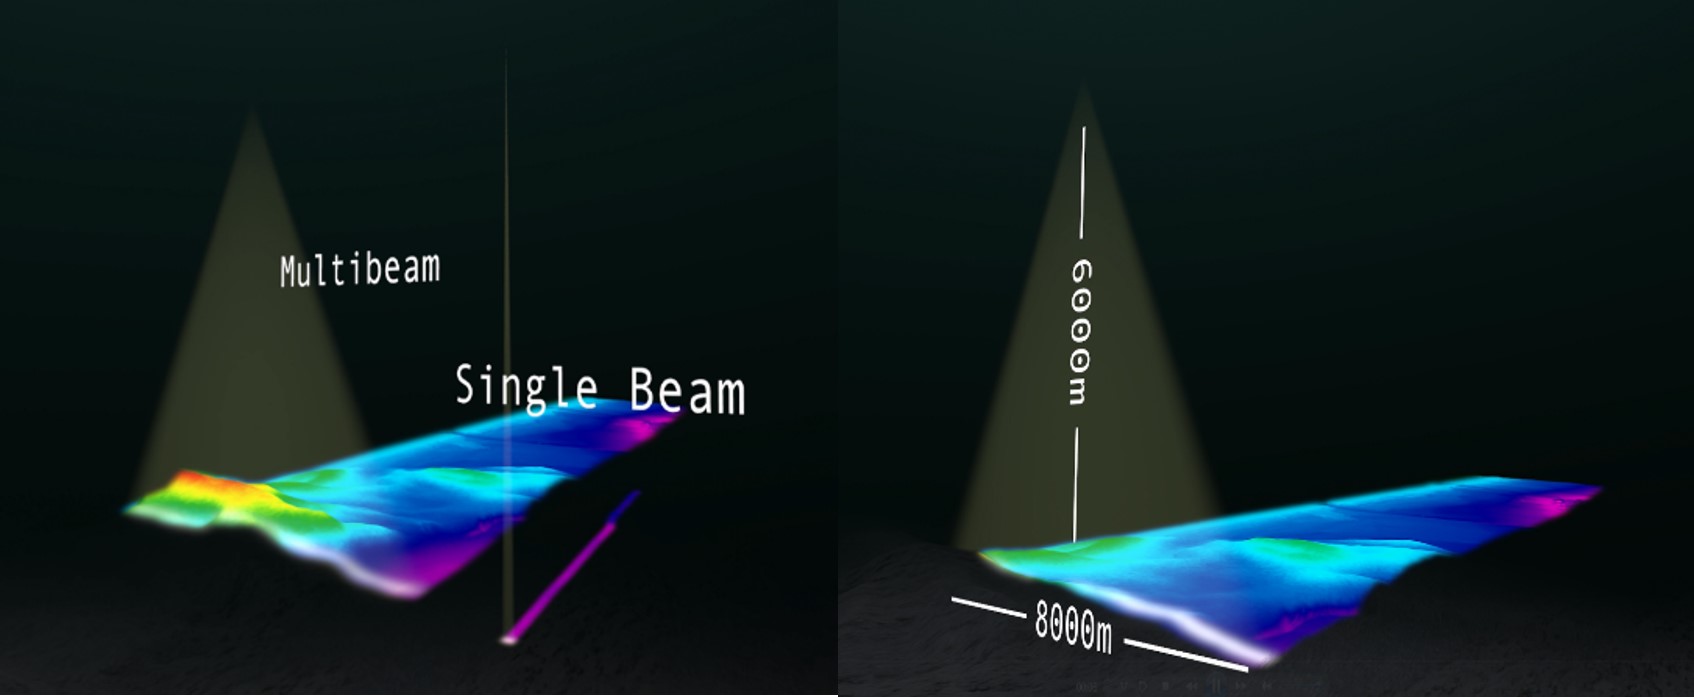
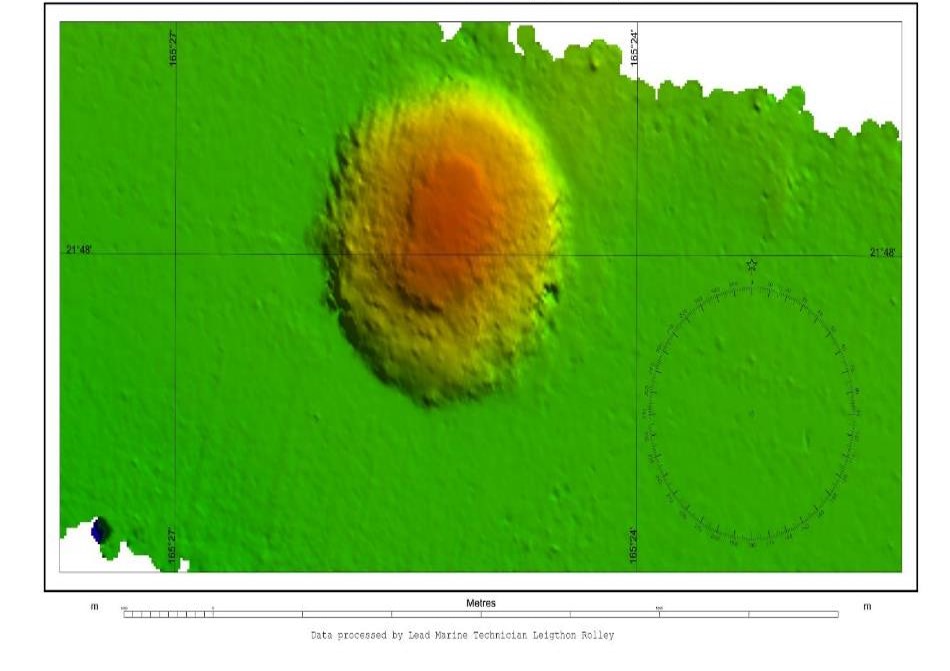
Included here, is also a visual of how a single-beam echo-sounder provides data for one point on the ocean floor versus the EM-302 that takes concurrent depth readings at many points. When these multiple points from the EM-302 are combined, they can be stacked together to produce a 3D map of the ocean bottom. By comparison, we can accomplish mapping a larger area of the ocean floor by using the latest technology in multibeam echo sounding. An example of an image produced from the EM-302 is this graphic of a small hill on the seabed roughly 450 m high and 2.5 km in diameter. This is just one image acquired as we travel to Tamu Massif, stay tuned as we will be posting more images soon.